
Breakouts in up trends, breakdowns in downtrends: 8 stocks total.
Price chart analysis and commentary.

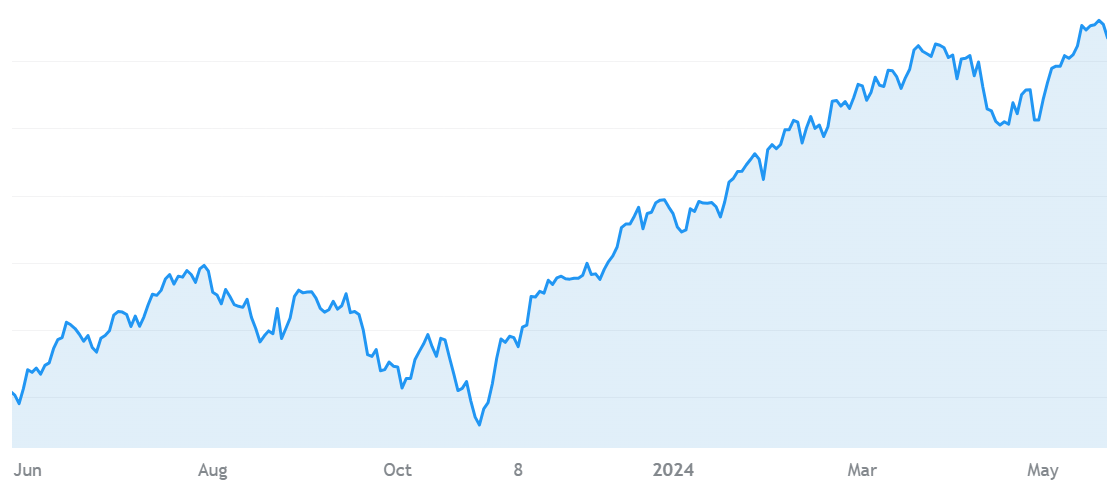
It’s a bubble powered by AI hype. The mania could go on for a while or could end anytime. I’ve posted previously how the negative divergences between key breadth indicators (new highs/new lows percent and bullish point-and-figure pattern percent) and price are significant and real. It’s only a matter of time.
When the markets finally give it up and tank…
Keep reading with a 7-day free trial
Subscribe to John Navin's Newsletter to keep reading this post and get 7 days of free access to the full post archives.