
Core Inflation Higher Than Expected. Yields Up, Stocks Tank. Oil & Gold Pause Rallies.
Price chart analysis and commentary.

With the March consumer price index showing core inflation at “higher than expected,” markets reacted: the bond market sold off and the stock markets headed lower. Gold and silver took a day off from their rallies. The price of oil went up.
This is 3 straight months where the CPI core inflation surprised the consensus view of economists. Markets are adjusting to the idea that the Fed may reconsider the “rate cuts soon, really, this time we mean it” policy. Rate hikes become a greater possibility.
It’s not my impression that markets are fully accepting that concept even with today’s selling.
The 10-year yield now nearing 4.6% is interesting but it should be more like 5% already if inflation is worse. The Nasdaq 100 is simply going through the motions of selling — it’s almost as if this was just a practice session. The money managers just hate to let go of NVIDIA and Meta — they’ve behaved so well.
Those are my initial thoughts. Here are the charts.
The S&P 500 daily price chart:

Although the index dropped below the early April low, it managed to close the day just above it and remains above the up trending 50-day moving average. The S&P 500 has not closed below the 50-day since November 2023. The 200-day moving average continues to trend steadily upward. No one wants to believe what the inflation story means.
The Nasdaq 100 daily price chart:

That’s a close higher than the earlier-in-the-month low as price keeps hugging the 50-day moving average which — on this chart — is slowing the uptrend look.
Here’s the daily price chart for the most actively traded stock, Tesla:

Managing to stay above the April low would be impressive except that the April high was unable to rise above the late March high. The 200-day moving average is now trending downward. The stock is trading below the 50-day moving average since mid-January.
The NVIDIA daily price chart is here:

The dip buyers just cannot keep themselves from the buy button and so the hottest stock among the Nasdaq 100 names closes higher on a down day for the index. This would impress except that it couldn’t make it back above yesterday’s high. The 50-day and the 200-day stick with relentlessly upward.
Did you notice today’s weirdness among the airline stocks? Delta and American Airlines started out the day strong and then collapsed. Take a look:
The Delta daily price chart:

Heavy selling volume once the stock approached the previous $49 high.
The American Airlines daily price chart looks like this:

It popped higher at the open and, just like Delta, spend the rest of the day falling off on substantial volume.
The benchmark gold stock ETF’s daily price chart:

They finally got a day of real rest, closing lower. The expectation is that the Fed may now end the “lower rates soon” dance. Higher rates might not be bullish for precious metals, but who knows, geopolitical events could take over.
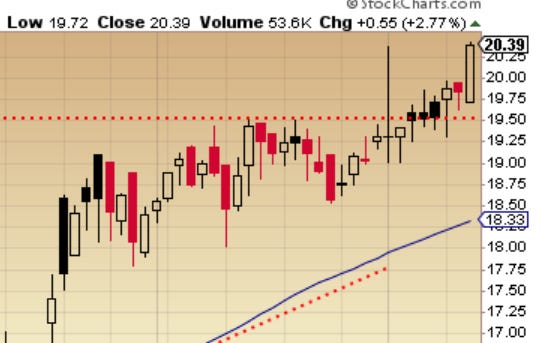
This gold miner ended higher anyway — the daily price chart for Nasdaq-traded A-Mark Precious Metals:

And this NYSE-traded Triple Flag Precious Metals ended “up” as well:

The daily price chart for the benchmark bond chart, the iShares 20+ Year Treasury Bond ETF, is here:

The gap down takes it down to a 2024 low and the selling volume is heavy. Price trades below both the down trending 50 and 200 day moving averages.
The daily price chart for the benchmark U. S. Oil Fund is here:

Let’s see if it has the strength to make a move above the $83 resistance. The 50-day and the 200-day moving averages are trending upward.
Exxon Mobil’s daily price chart looks like this:

That’s a new high for the global oil company even as USO failed to get there. Some of this is big Wall Street money managers taking off “growth” positions and finding what they think of as “value” positions.
The daily price chart for Mach Natural Resources is here:

The lightly traded NYSE-listed oil and gas company is continuing to rally after that spike up that took out the earlier March high.
Not investment advice. For educational purposes only.
Will banks and oil companies see the greatest benefit of more rate hikes?