If every stock in the S&P 500 was assigned an equal weighting, the price chart for the index takes on quite a different look and meaning. The chart most followed, the standard S&P 500, sports a heavier weighting for the few closely watched, big market capitalization tech stocks.
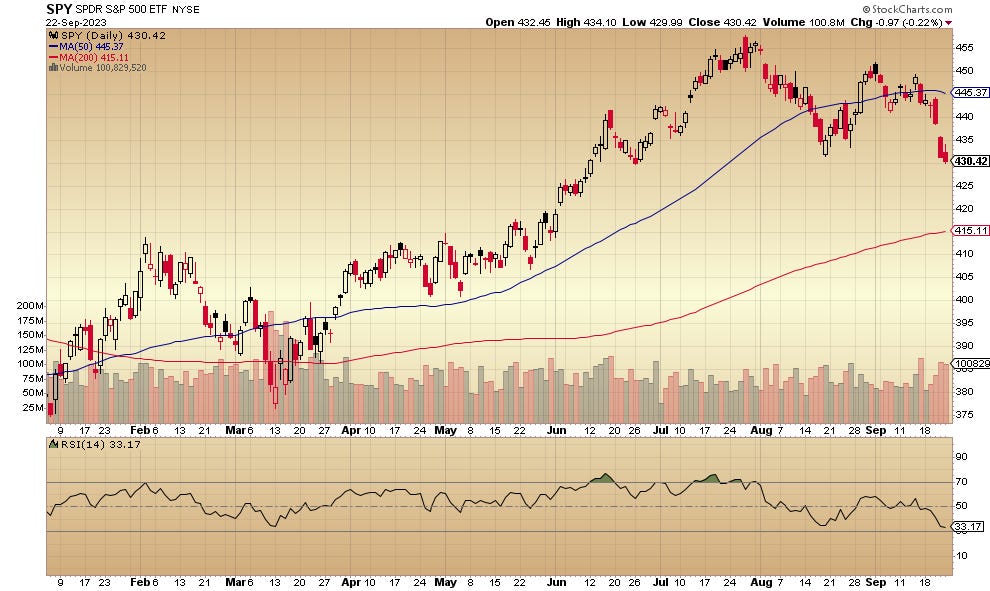
The weighted-in-favor-of tech stocks — the one most followed — S&P 500 ETF looks like this:
Note how far above its 200-day moving average this index fund sits.
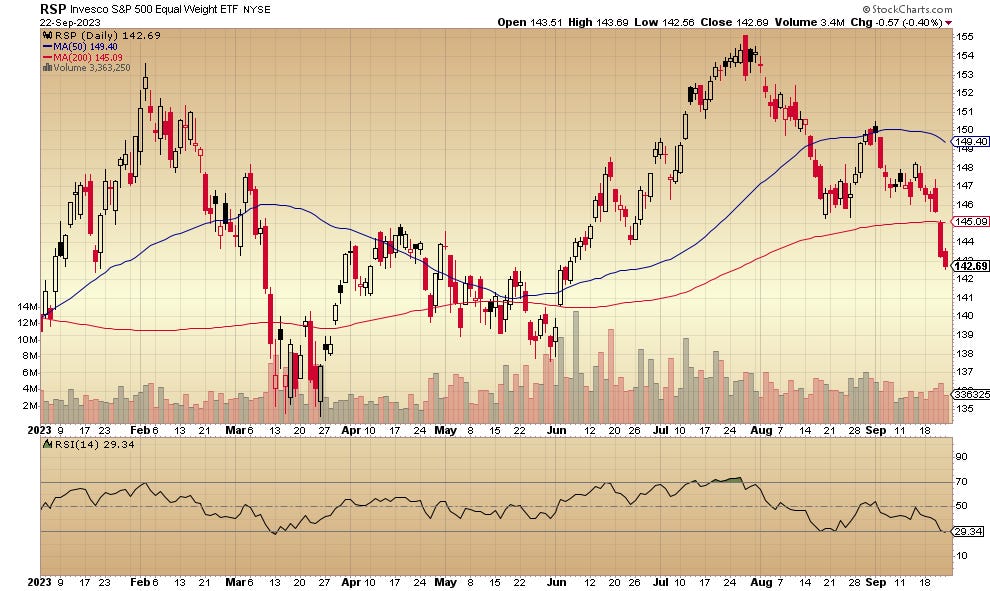
Now take a look at how it appears for equal weighting of the 500 stocks, without regard to market cap:
Analyzed from this perspective, the “stock market” is already below the 200-day moving average a concerning, less-than-bullish look.
Most of the stocks within the S&P 500 are way behind the performance of the hot tech and social media components.


So either the "high and mighty" will correct or the laggards will rise. October is going to get in the way but the laggards will rule after the big boys crash.