
Fear Index Heads Back Down Into Less-Fear Zone
Also: a reading on the put/call index

The VIX also known as the Volatility Index — and sometimes referred to as the “fear index” — is on its way back down into the level that often represents “too much confidence.”
This chart is the visual demonstration of “soft landing” thinking – where economists believe that a recession has been avoided and that growth may be about to unfold again, thanks to the Fed’s steady hand or something.

That 13 area proved to be a low reading in June and July before interest rate worries took bonds and stocks to lower prices. The VIX blasted upward to just below 19 in mid-August.
Comments by Fed Chair Jerome Powell at the Jackson Hole Economic Symposium seem to have reassured markets about rates.
This “fear” index could stay at the 13 level for weeks or even months. Take a look at the weekly chart:
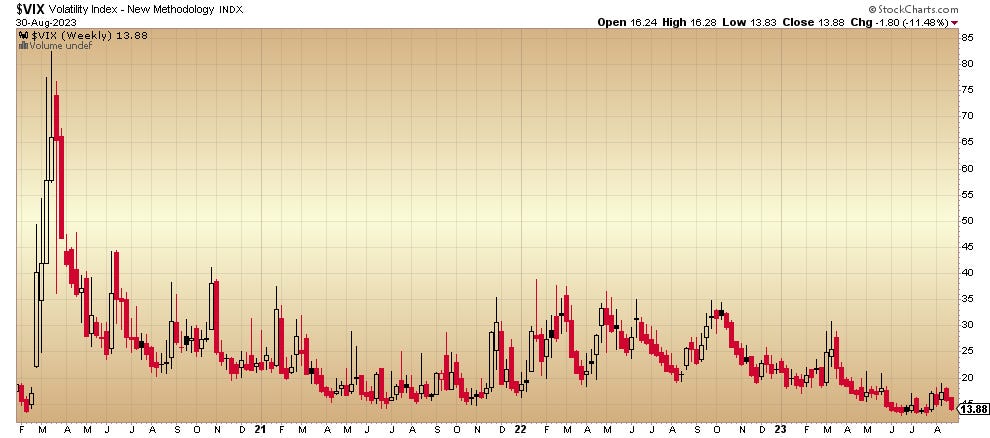
That extraordinary move up to above 80 came during the 2020 March/April pandemic scare and represents an outlier. The very low interest rate policy that the Fed began then helped to stimulate growth and to regain confidence in the economy.
The up moves in the index to the 35 level during 2022 and early 2023 may be providing a range: comfort equals about 13, discomfort takes it to 35 or so.
That the VIX appears to be settling in the apparent comfort zone is troubling to contrarians who view it as a sign of perhaps too much bullishness among too many market participants.
The CBOE put/call ratio seems to verify the “comfort” narrative as traders are returning to the buying of more calls (bets that stocks will go up) than puts (bets that stocks will drop). Take a look at the chart:
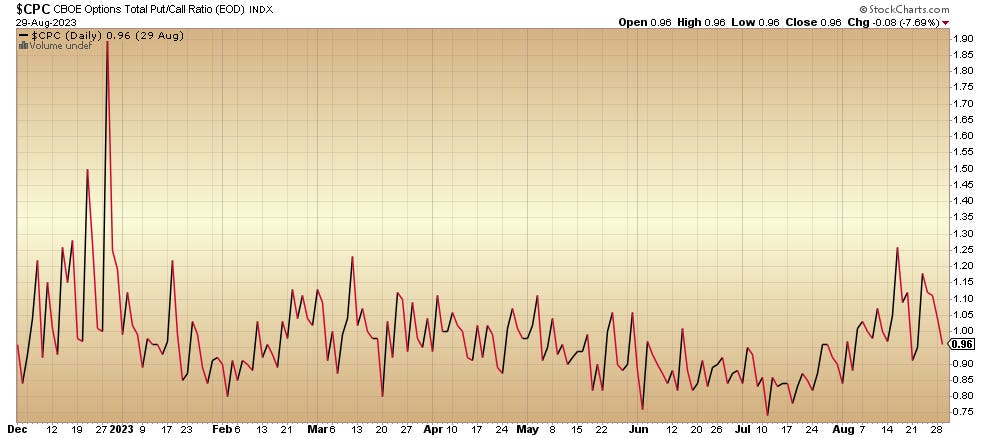
It seems to have peaked in mid-August – how it remains somewhat elevated despite gains made by major options-traded stocks such as NVIDIA and GOOGL is a matter to consider. Apple, Amazon and Meta have yet to make it up to the earlier-in-the-summer highs.
Will this put/call ratio return to .75 or near it?
Not investment advice. For educational purposes only.