
Friday, 6/6:
Price chart analysis and commentary

$NYAD:
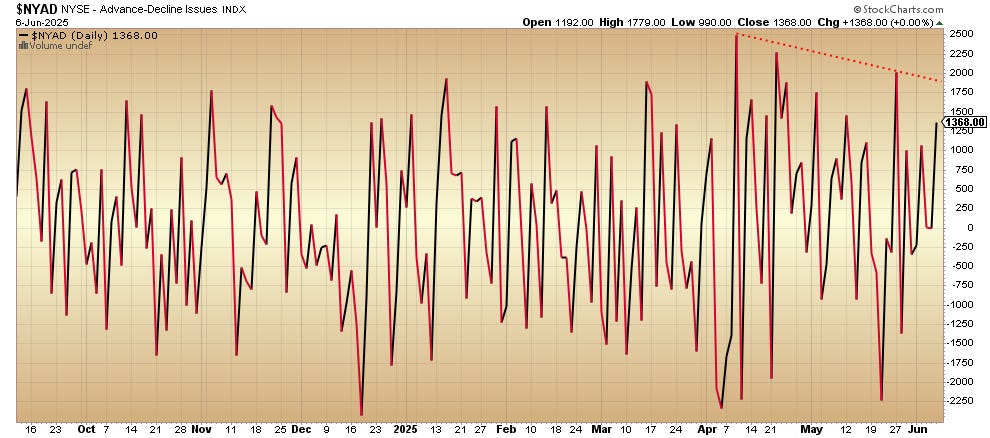
The NYSE advance/decline line can’t make it up to the April and May peaks. Breadth is weakening on each S&P 500 price high.
S&P 500:
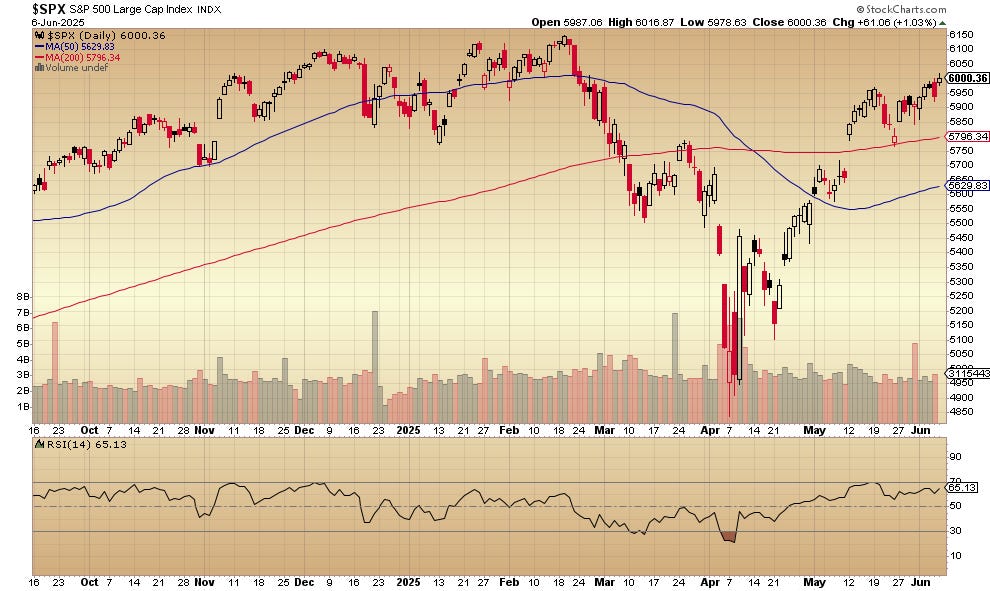
The 1.03% gain takes the index over the 6000 level for the first time since February. The 50-day and the 200-day moving averages continue to trend upward.
Nasdaq 100:
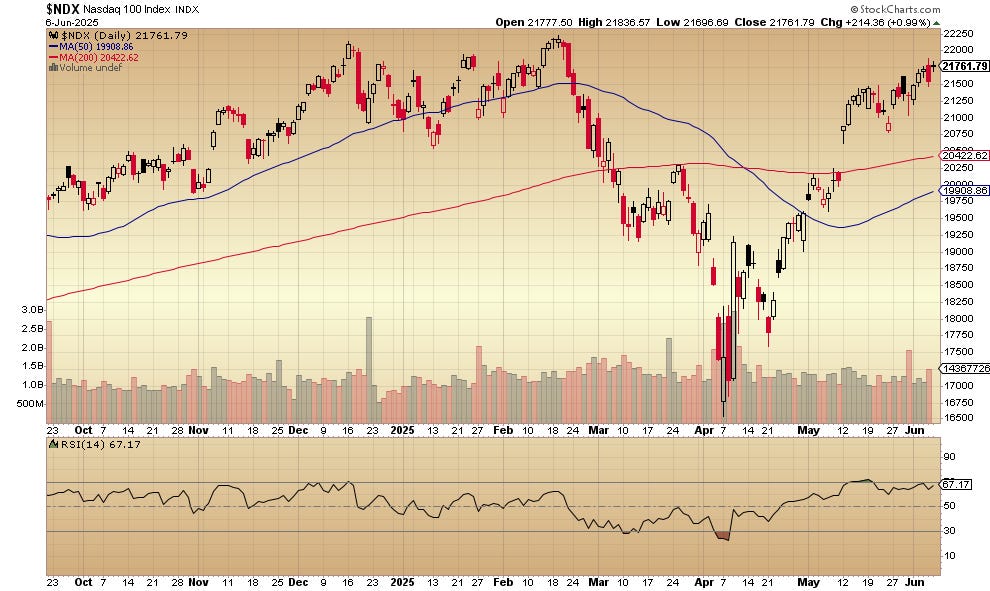
It’s an uninspiring inside day candlestick for this index: no higher than Thursday’s high and no lower than its low.
iShares 20+ Year U. S. Treasury Bond ETF:
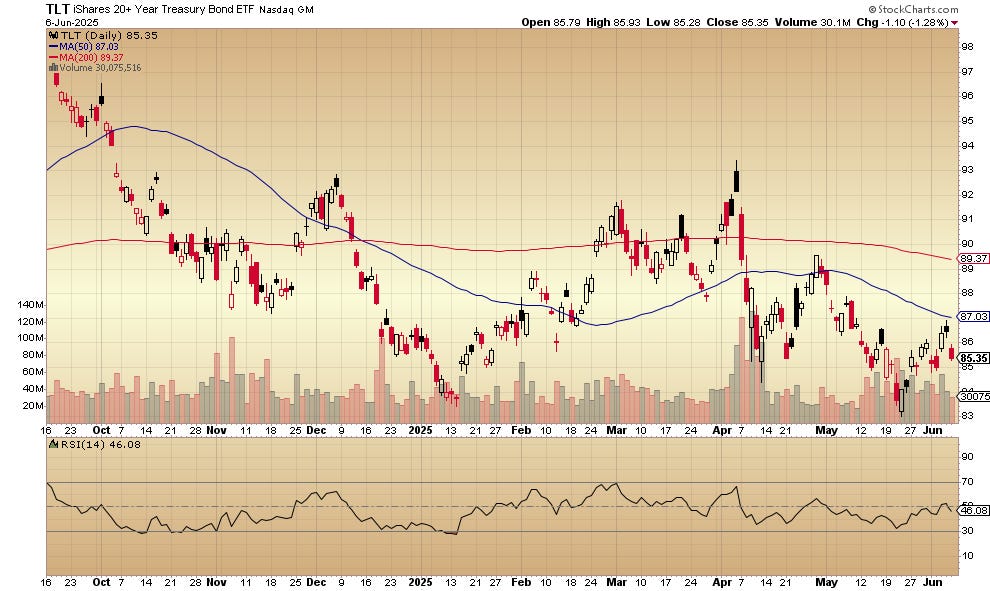
The bond fund drops 1.28% as bond yields rise. Note that the price remains below both the downtrending 50-day and 200-day moving averages.
SPDR Gold Shares:
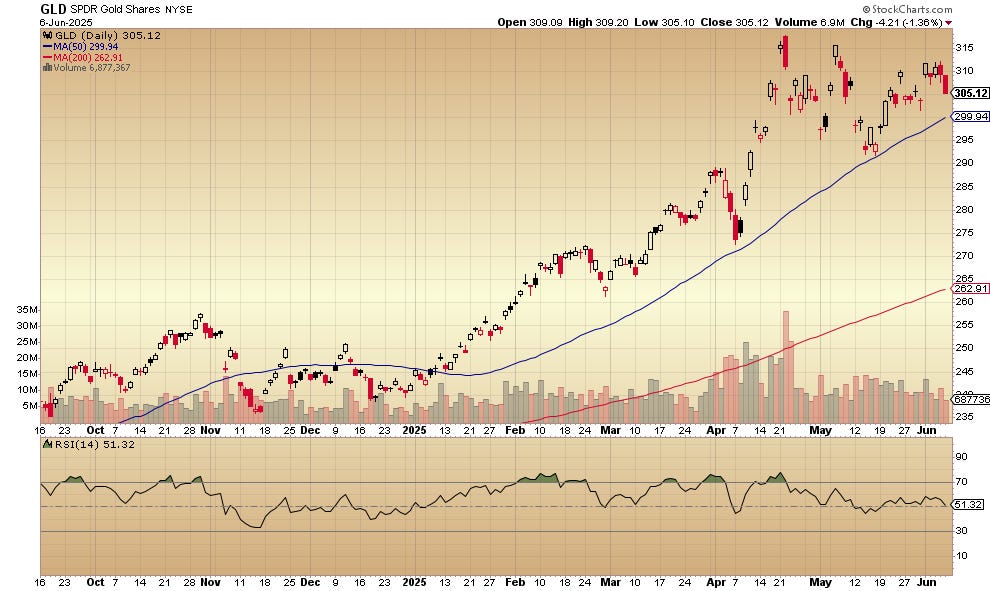
The 1.36% price slide almost fills Monday’s gap up. A test of the uptrending 50-day moving average may be in order.
United States Oil Fund:
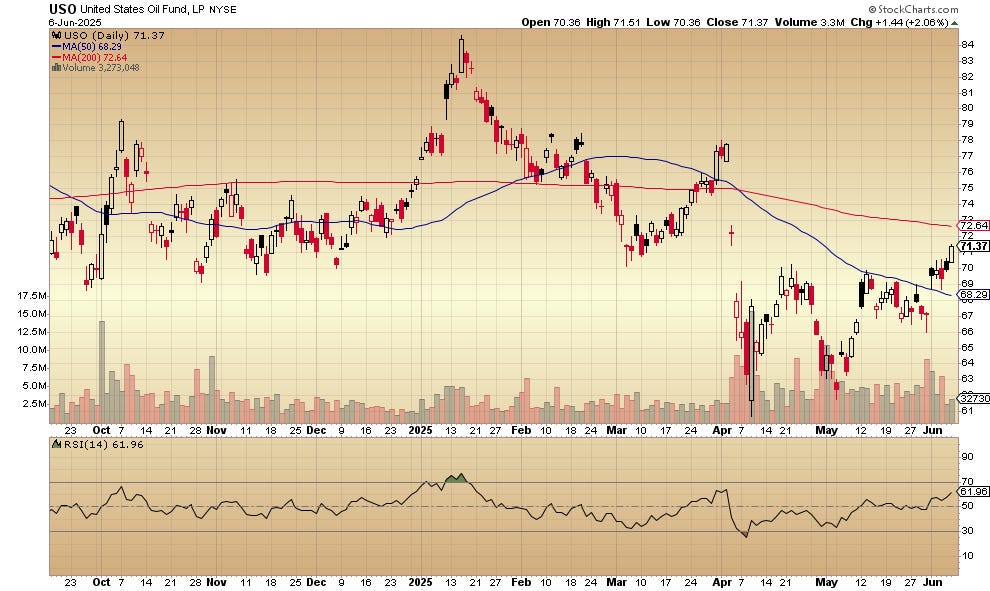
Today’s 2.06% gain makes it one week of price above the 50-day moving average. The downtrending 200-day moving average is just above.
This content is for informational purposes only. Do not consider any information here as investment, financial, or other advice. Nothing on this post constitutes a recommendation or endorsement to buy or sell any security. You alone assume the sole responsibility for evaluating the merits and risks associated with your use of information derived from reading material on this post.