
Monday: Stocks Up,
Price chart analysis and commentary

The S&P 500:
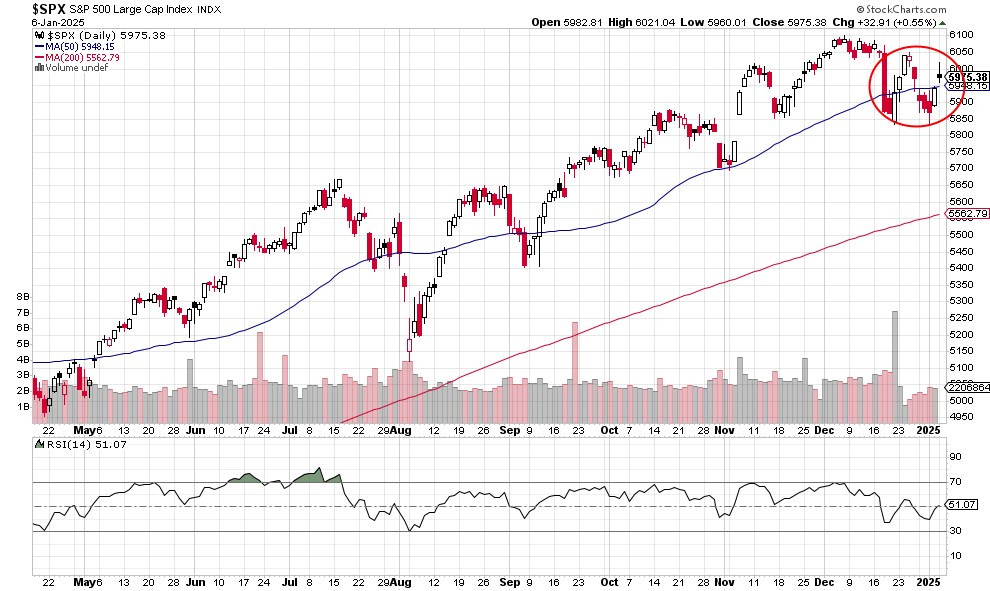
The rally early in the session faded and the gain is just .55%. Still, it’s a close back above the 50-day moving average.
The Nasdaq 100:
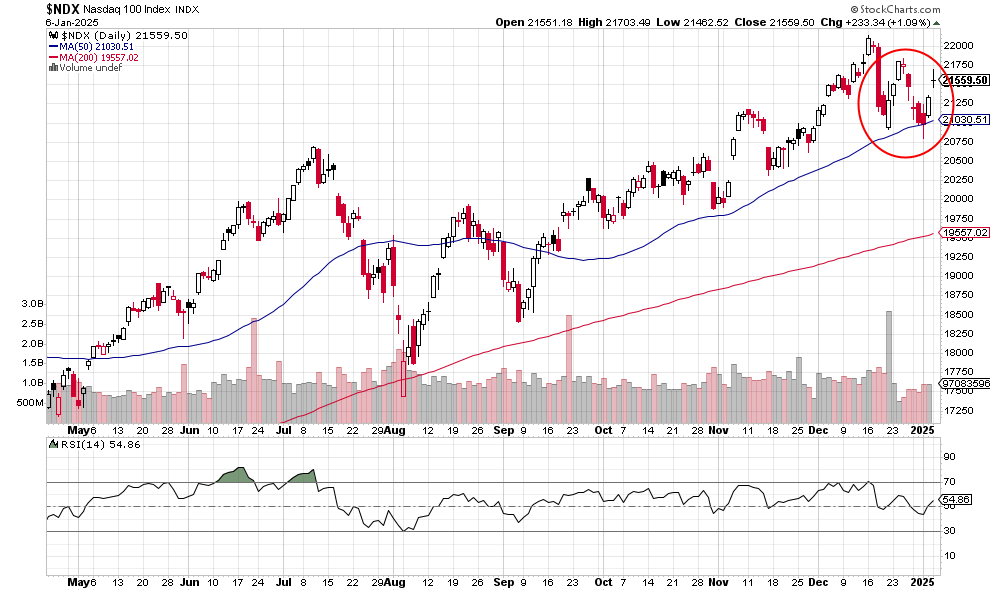
It’s a nice 1.00% gain but price is unable to rally to above the 21750 level and it’s definitely not a new high. Also, that’s a doji candlestick, not that encouraging for the near-term. Both the 50-day and the 200-day moving averages are having no trouble trending up.
The iShares 20+ Year U. S. Treasury Bond ETF:
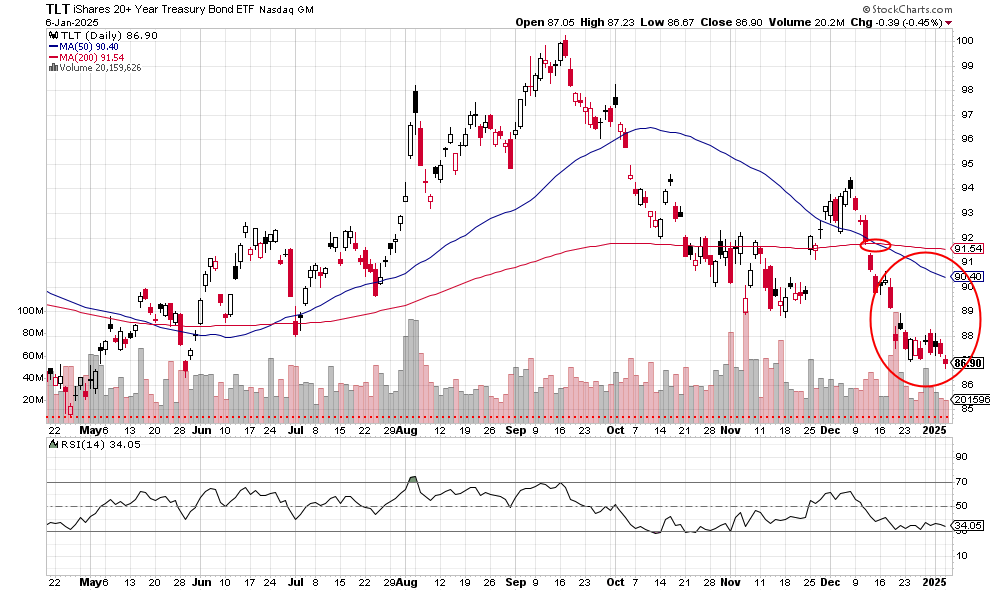
Bonds remain in a downtrend: that’s a -.45% session and both moving averages seem to be headed downward. The red dotted line at just below 85 is the likely support level from the late April low. A drop below there would give the chart a new and different look.
The United States Oil Fund:
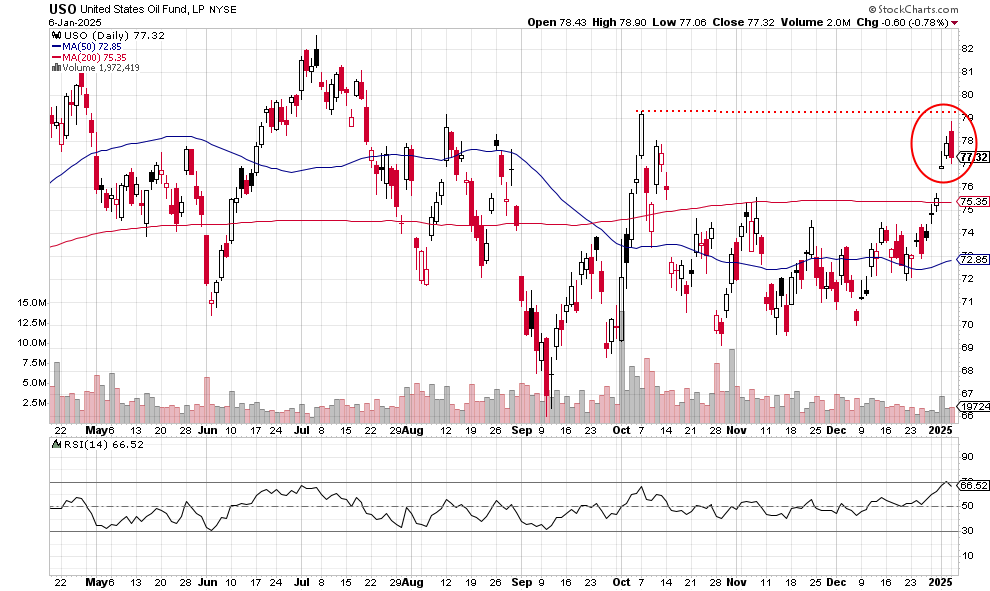
The fund rallied early and then reversed for -.78% session. The price is unable to make it above the early October high at just above 70 (red dotted line). As it approaches that level, sellers show up.
The SPDR Gold Shares:
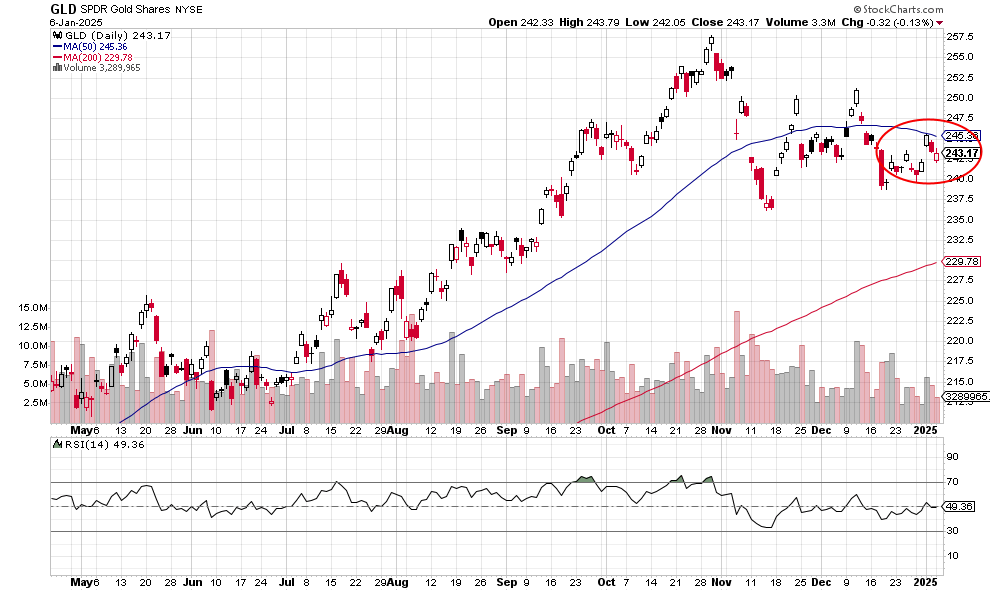
A ho hum session with the shares losing .13%. The 50-day moving average has turned down.
Not investment advice. For educational purposes only.
I write about stocks at Forbes.com.