


Wednesday, 7/9: Stocks Up, Bonds Up, Gold Up
Price chart analysis and commentary

S&P 500:
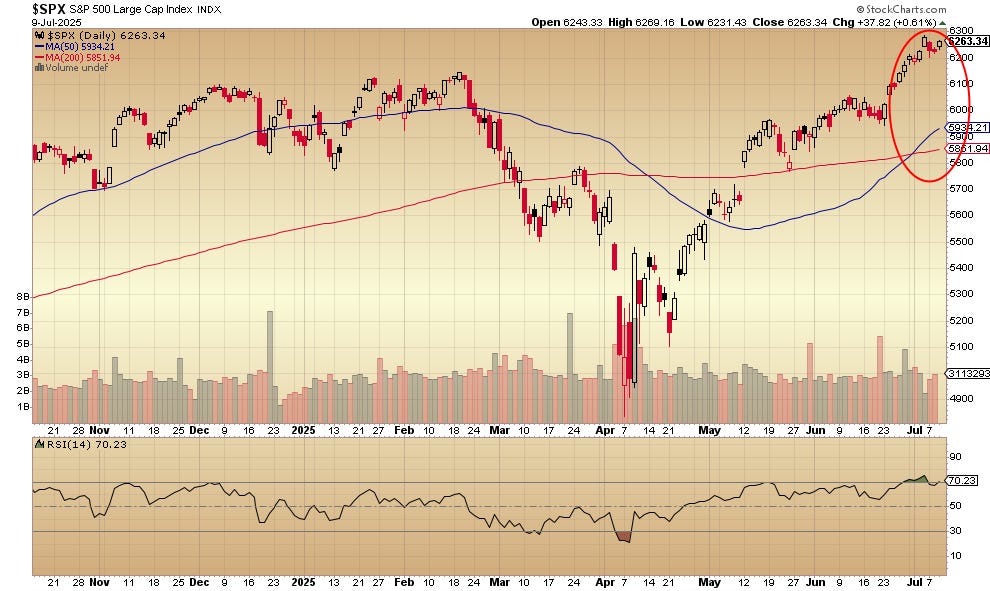
The gain of .61% is not enough to take the index above last Friday’s high. This is a different picture than the Nasdaq 100 (below).
Nasdaq 100:

The .72% gain takes the index to a new high, unlike the S&P 500 which could not quite get there. The relative strength indicator (RSI, below the price chart) shows a negative divergence from price, suggesting weakness despite the new high.
iShares 20+ Year US Treasury Bond ETF:
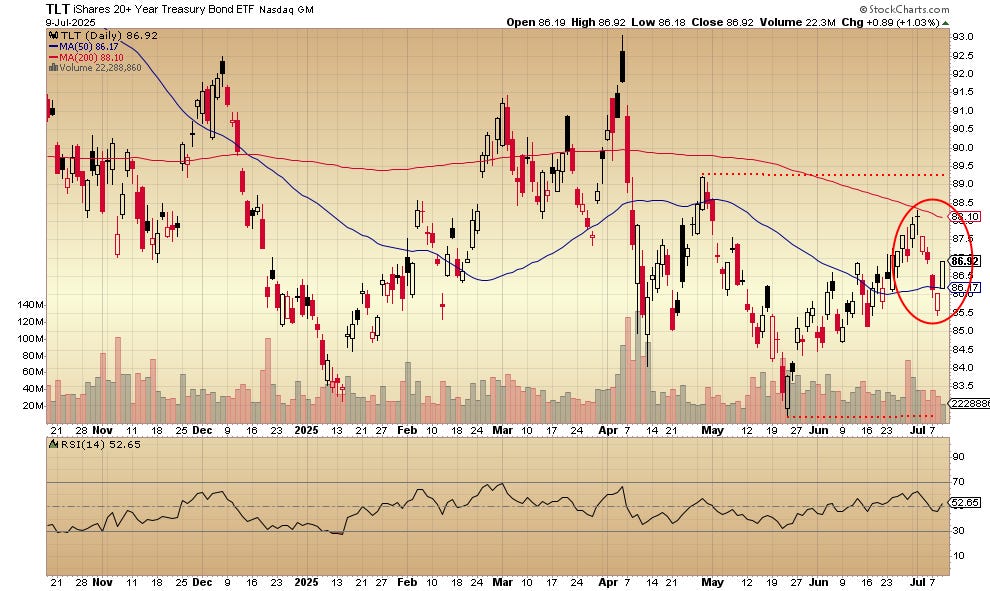
The price of the bond fund rises back above the 50-day moving average. The gain of 1.03% is not enough to take it above the downtrending 200-day moving average. The red dotted lines show the near-term targets for up and down.
SPDR Gold Shares:

The price action of +.42% keeps today’s trading range within that of yesterday’s, for an inside day. The April through July pattern remains inside the triangle, awaiting a break in one direction or the other.
United States Oil Fund:

The .06% drop leaves the fund with an "inside day” candlestick: no higher and no lower than the price action of the previous session. Both the 200-day moving average and the 50-day moving average are trending upward.
If you find my work useful, please take a moment to become a paid subscriber. That way, you get all the goods.
I contribute to Forbes.com right here.
This content is for informational purposes only. Do not consider any information here as investment, financial, or other advice. Nothing on this post constitutes a recommendation or endorsement to buy or sell any security. You alone assume the sole responsibility for evaluating the merits and risks associated with your use of information derived from reading material on this post.