
Wednesday: Stocks Up (Except For Small Caps), Bonds Off, Oil Down, Gold Up
Price chart analysis and commentary

The S&P 500:
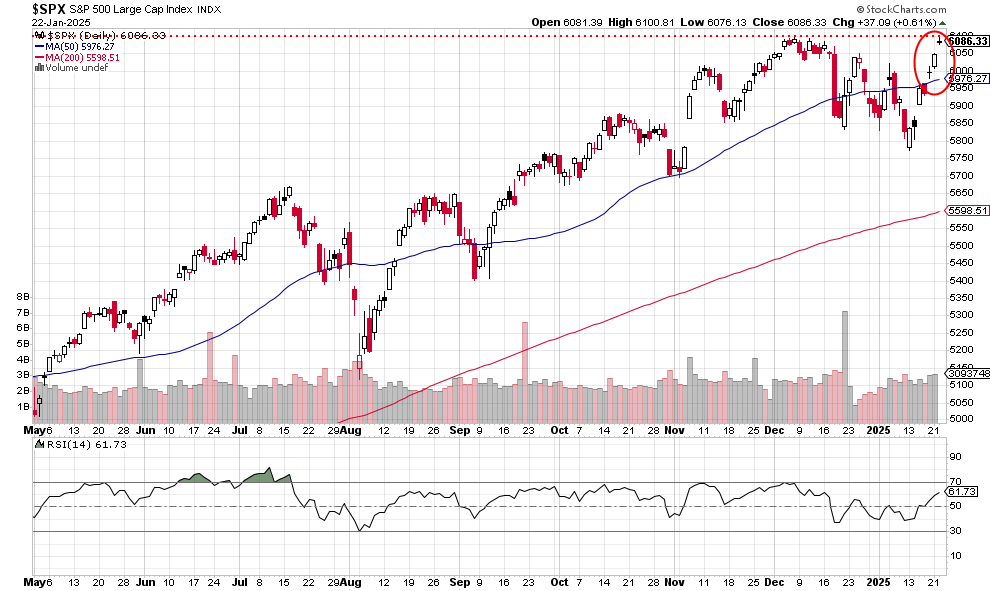
Price made an early-in-the-session high, then pulled back and spent the rest of the day below it. Three closes above the moving average now — the relative strength indicator (RSI, below the price chart) is diverging negatively from price.
The Nasdaq 100:
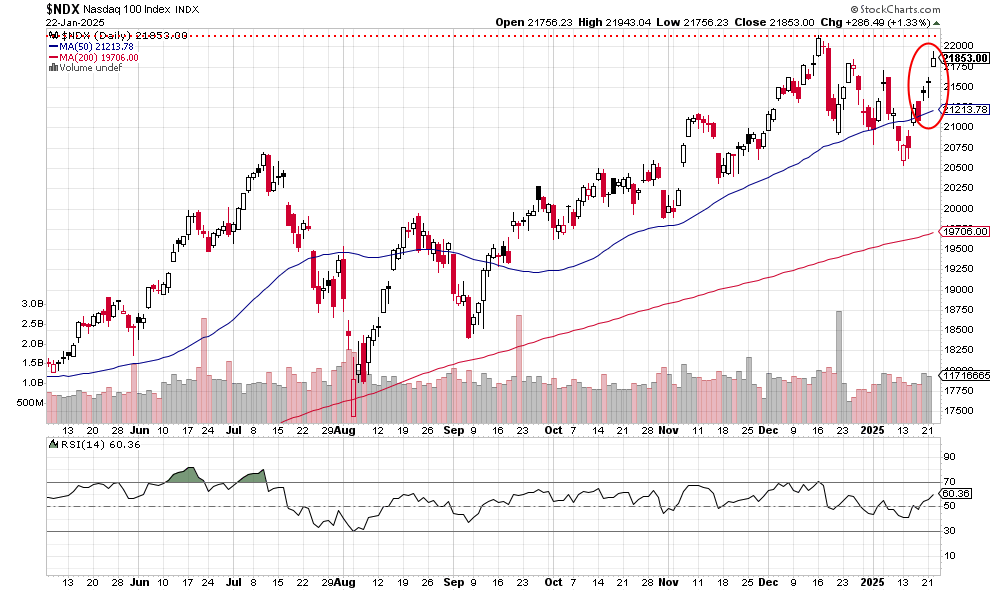
No new high for this index despite the ability of the S&P 500 to make it up there today. Three closes above the 50-day moving average is a good look but the underperformance vis a vis the large caps continues.
The iShares Russell 2000 small caps ETF:
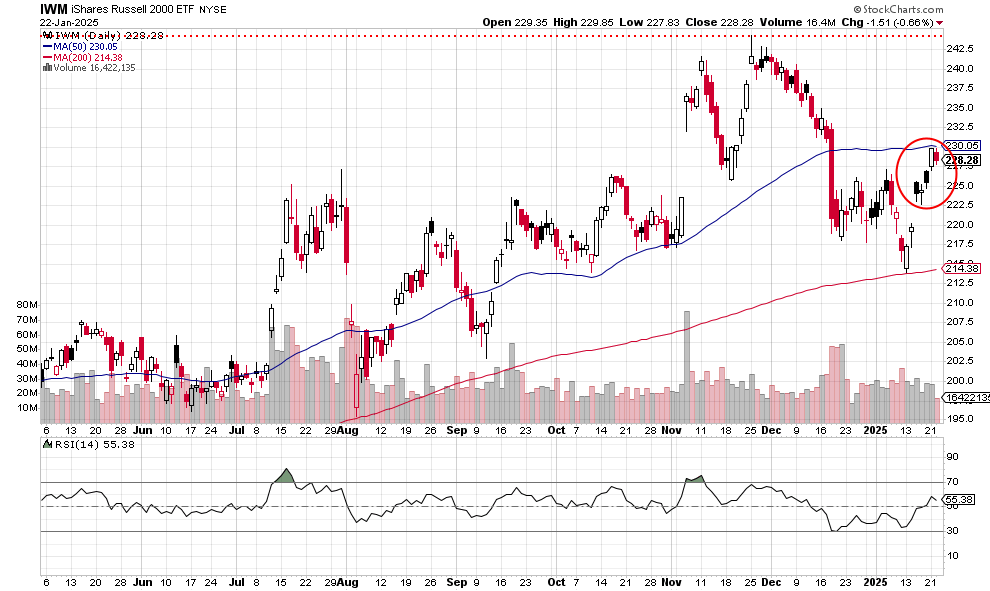
The small cap ETF is unable to rise above the 50-day moving average. While other stock indexes hit or approach new highs, this one is not even close. Such a picture casts doubt on extreme bullishness for stocks as a whole, whatever the index.
The iShares 20+ Year U. S. Treasury Bond ETF:
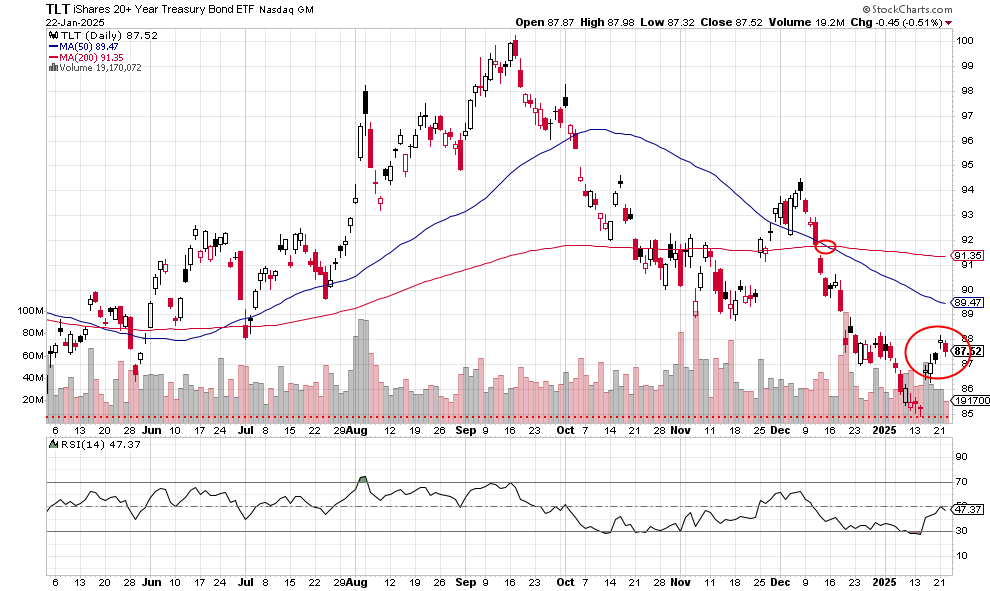
The big bond ETF takes a day off from the recent rally phase and closes down by .51%. Price remains in a basic down-trend mode. Watch for a test of the 85 level (red dotted line).
The United States Oil Fund:
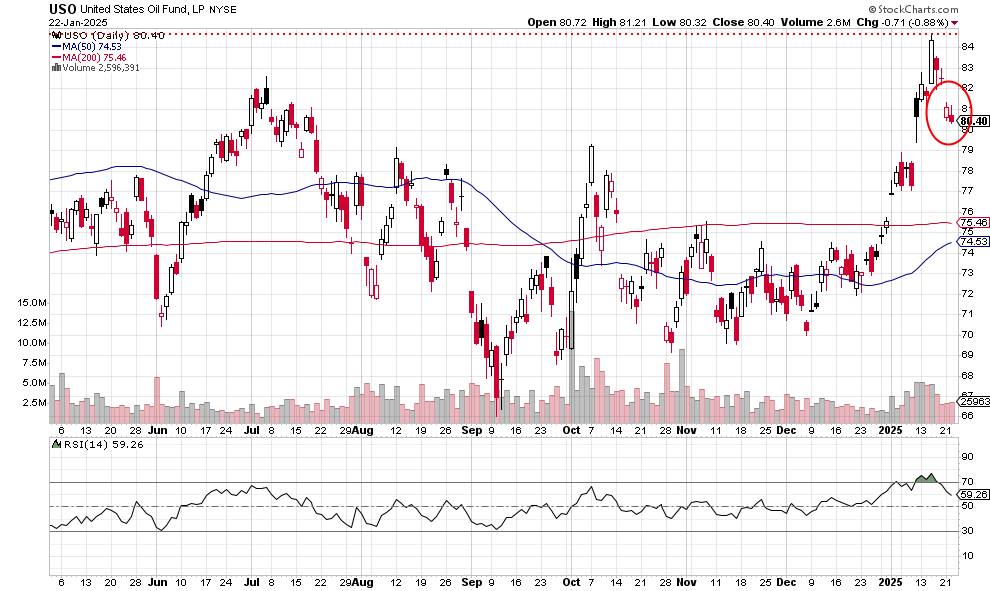
The oil fund closes below yesterday’s trading range with a .88% drop.
The SPDR Gold Shares:
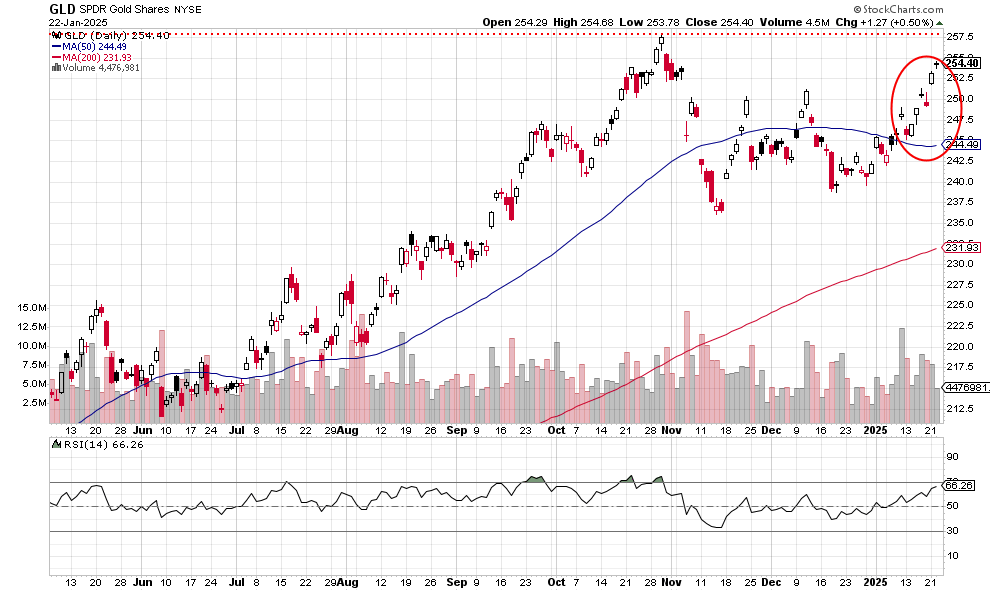
Another up day for the gold shares: +.50%. The price now has nine closes above the 50-day moving average. The 257.50 level will be resistance.
Paid subscribers receive the deeply researched analysis of significant price chart breakouts or breakdowns among stocks.
Not investment advice. For educational purposes only.
I write about stocks at Forbes.com.